
November 5, 2025
|
5 min read


Get instant access to a live TrueFoundry environment. Deploy models, route LLM traffic, and explore the full platform — your sandbox is ready in seconds, no credit card required.


Updated: March 6, 2025


Blazingly fast way to build, track and deploy your models!
Elasti is an innovative open-source solution designed to optimize Kubernetes resource usage by enabling services to scale down to zero during idle periods and scale back up on demand. Built with a dual-component architecture—a Kubernetes controller and a request resolver—Elasti seamlessly manages service availability while minimizing costs. This post aims to be a technical walkthrough of its architecture, installation, and operational flows, ensuring you can integrate and extend Elasti effectively in your Kubernetes environments.
💡This feature is included within Truefoundry’s autoscaling suite. For additional details, please refer to the documentation.
While Kubernetes offers robust scaling capabilities through HPA and solutions like KEDA, scaling to zero replicas remains challenging. Existing approaches typically fall into two categories:
Elasti was created to address these limitations with three key design goals:
Elasti comprises of two core components that work in tandem to manage service scaling:
Controller (Operator):
Resolver:
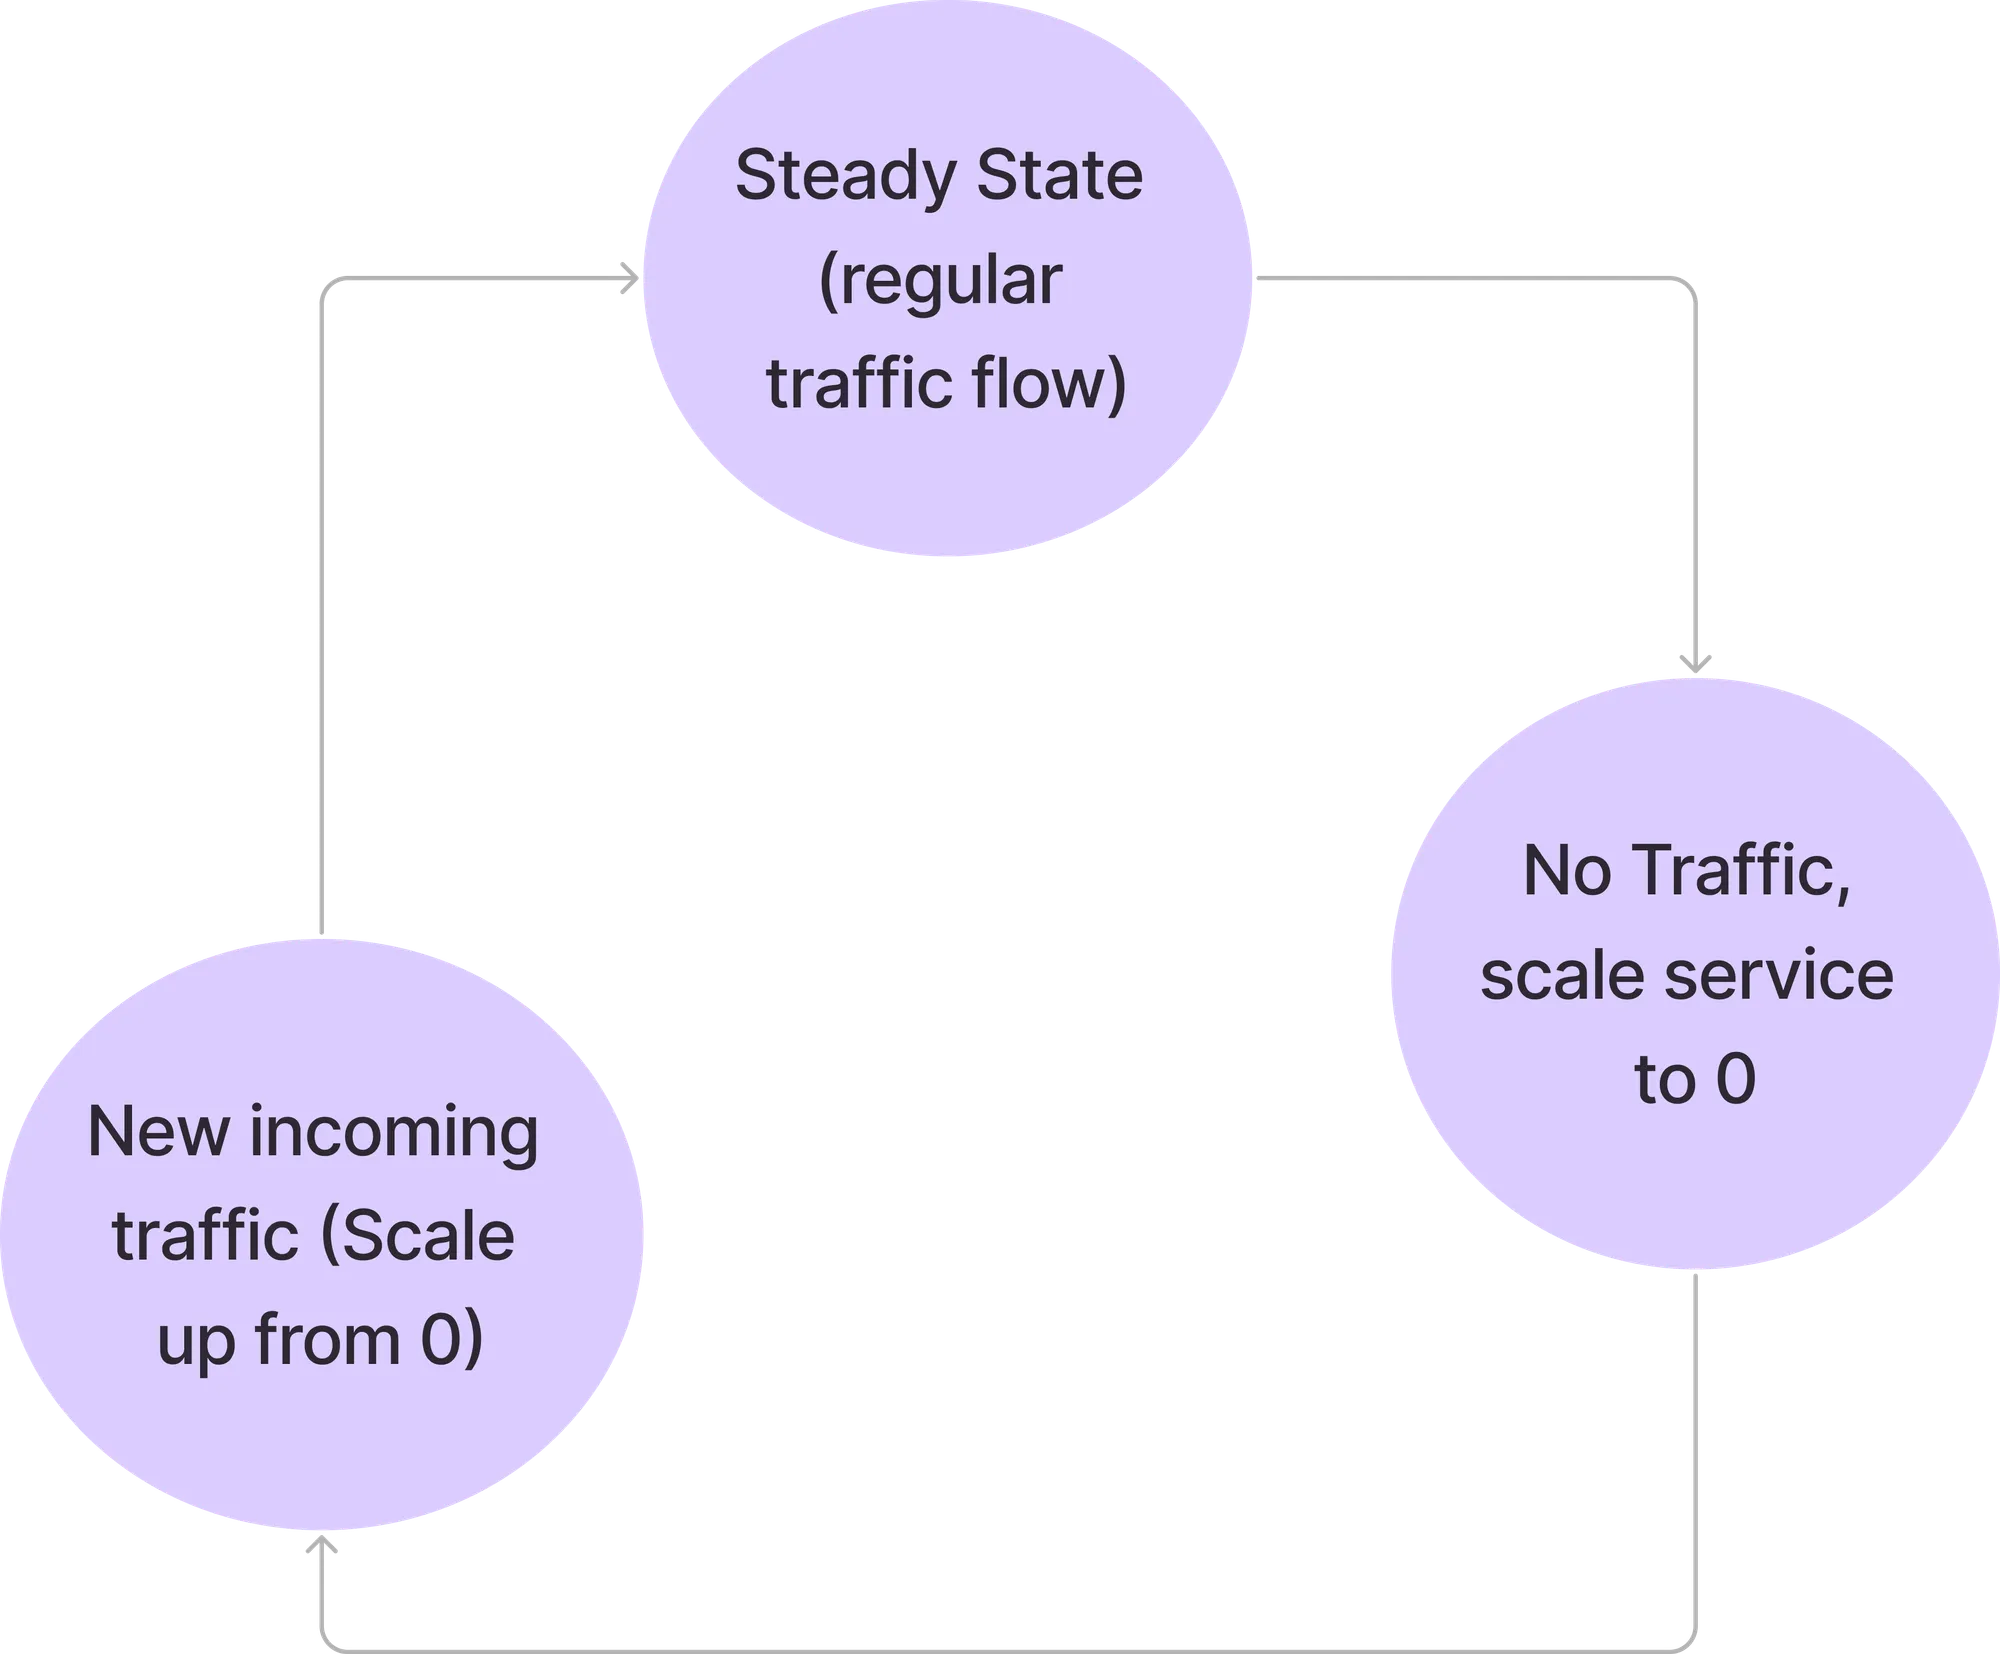
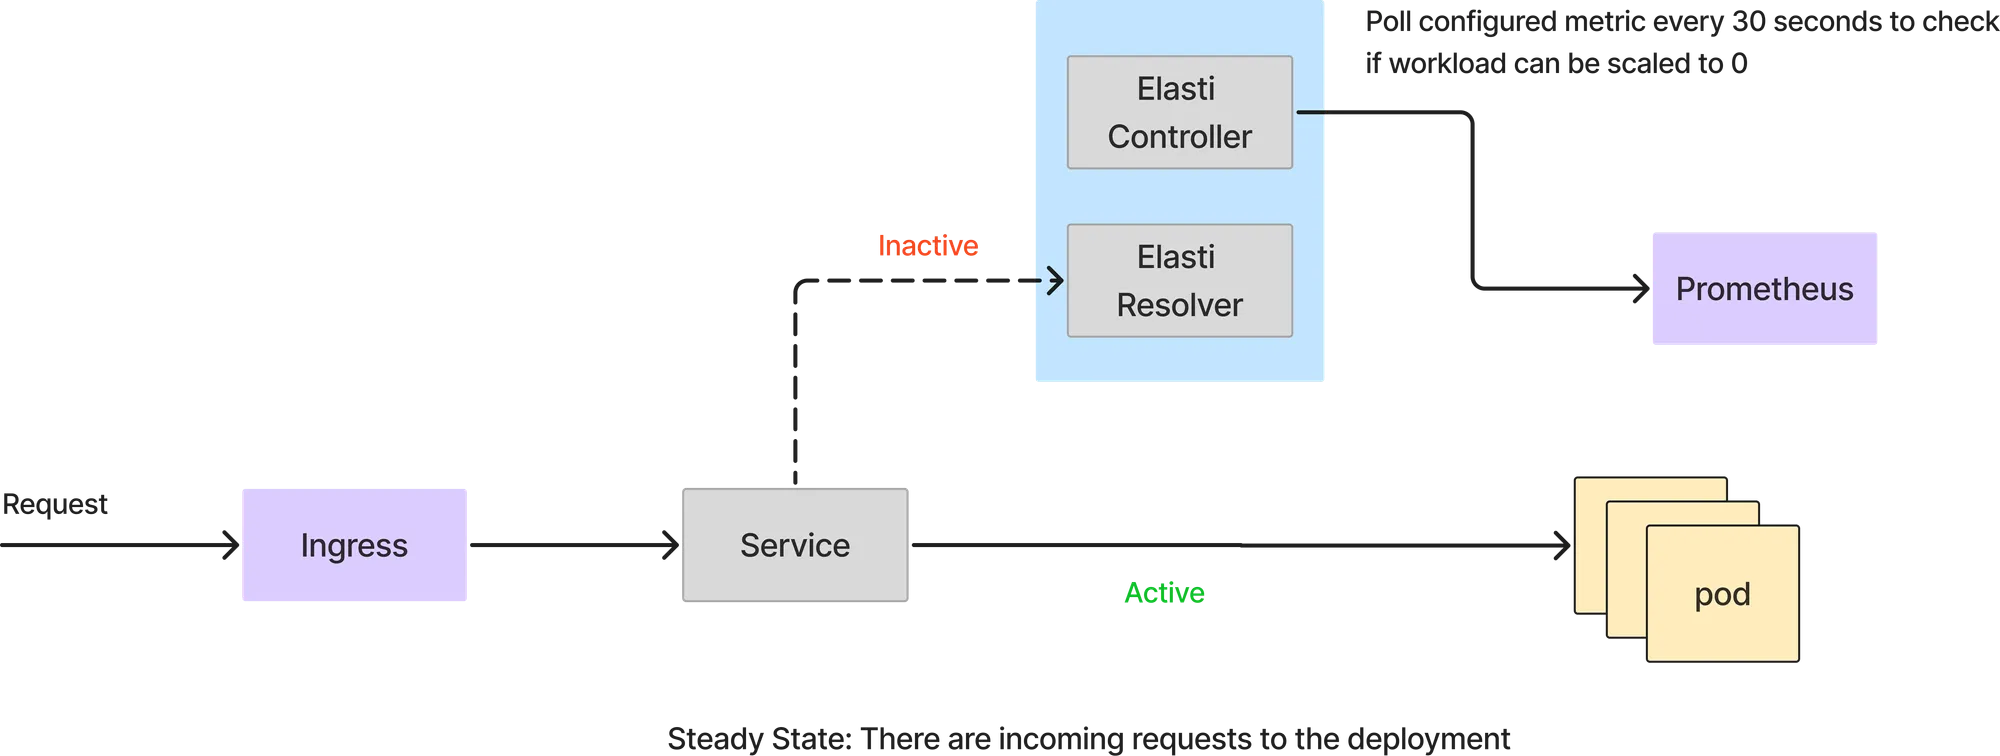
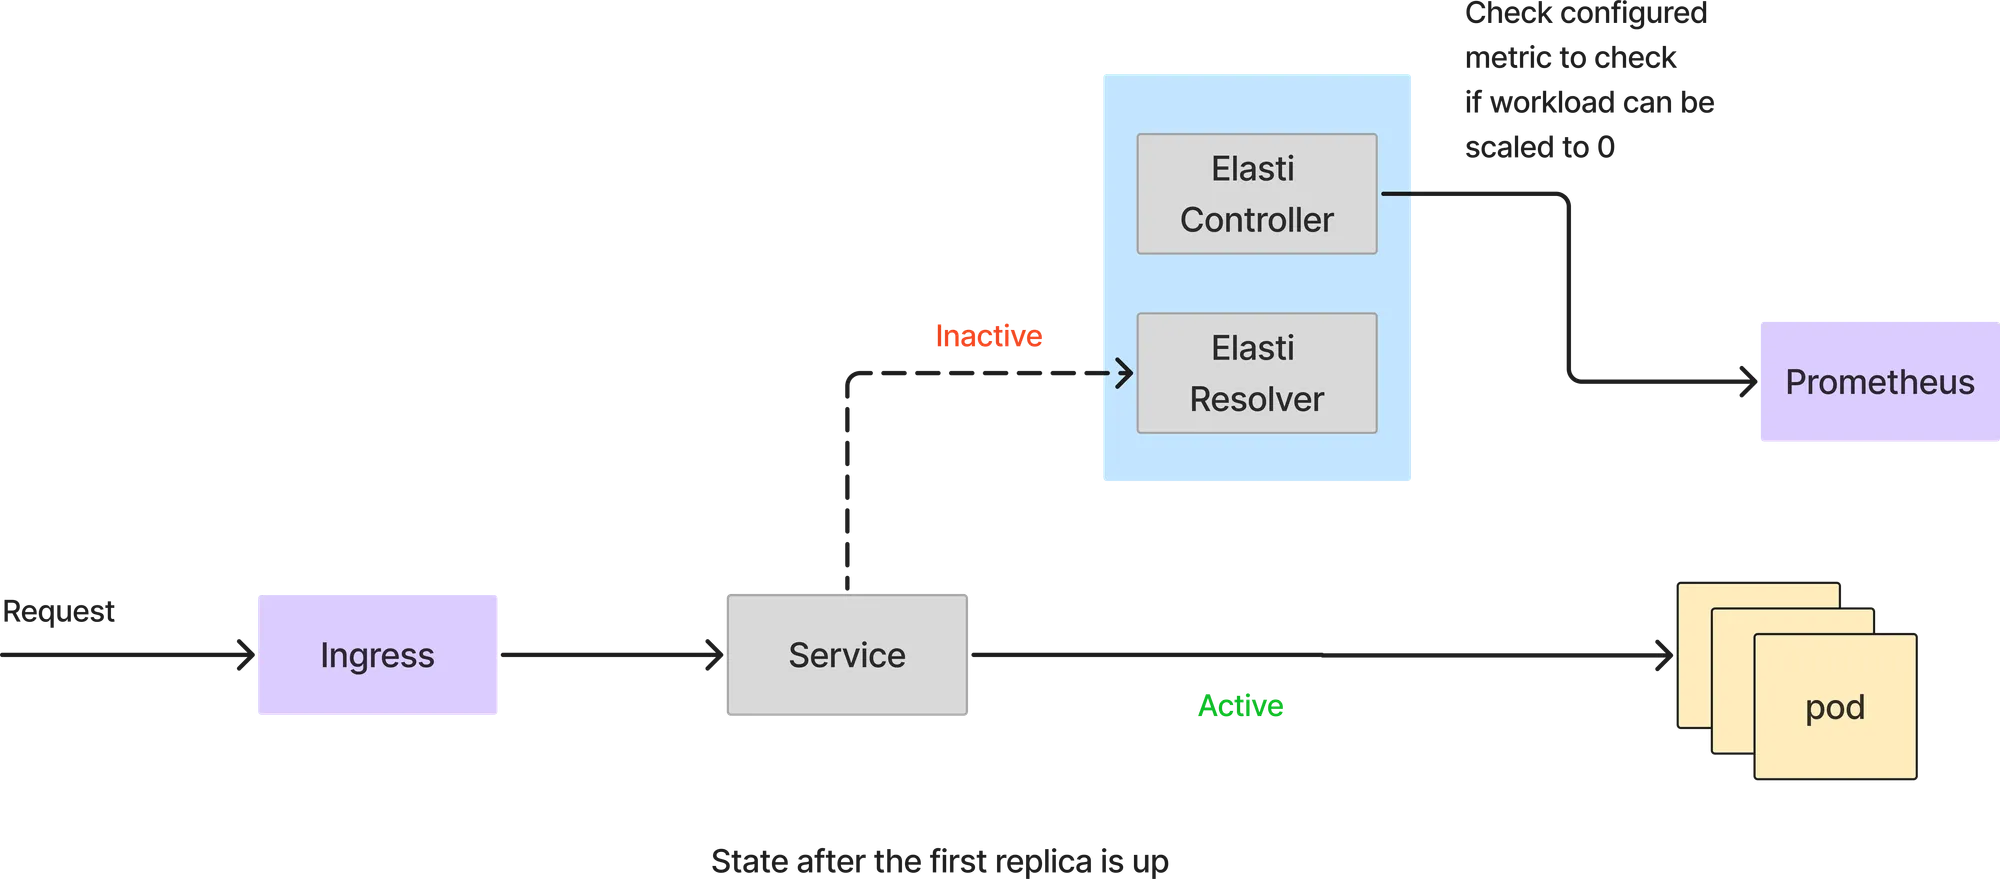
In this mode, all the requests are handled directly by the service pods. The Elasti resolver doesn't come into the request path. Elasti controller keeps polling prometheus with the configured query and checks the result with threshold value to see if the service can be scaled down.
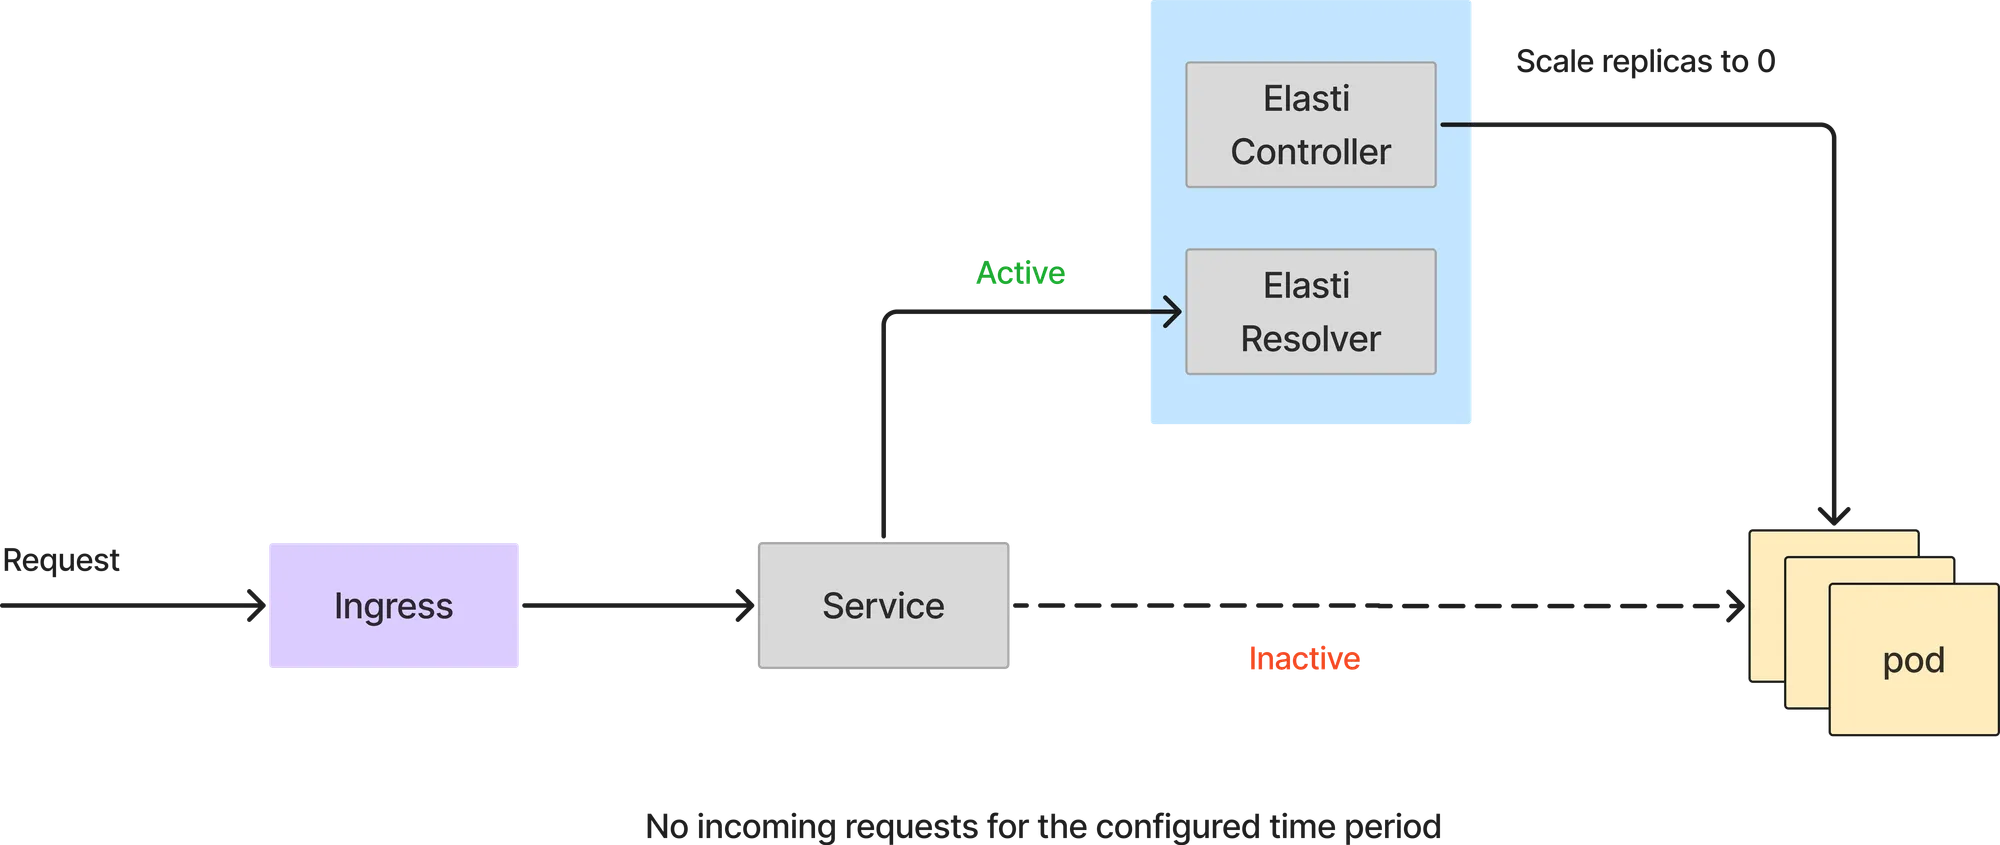
If the query from prometheus returns a value less than the threshold, Elasti will scale down the service to 0. Before it scales to 0, it redirects the requests to be forwarded to the Elasti resolver and then modified the Rollout/deployment to have 0 replicas. It also then pauses Keda (if Keda is being used) to prevent it from scaling the service up since Keda is configured with minReplicas as 1.
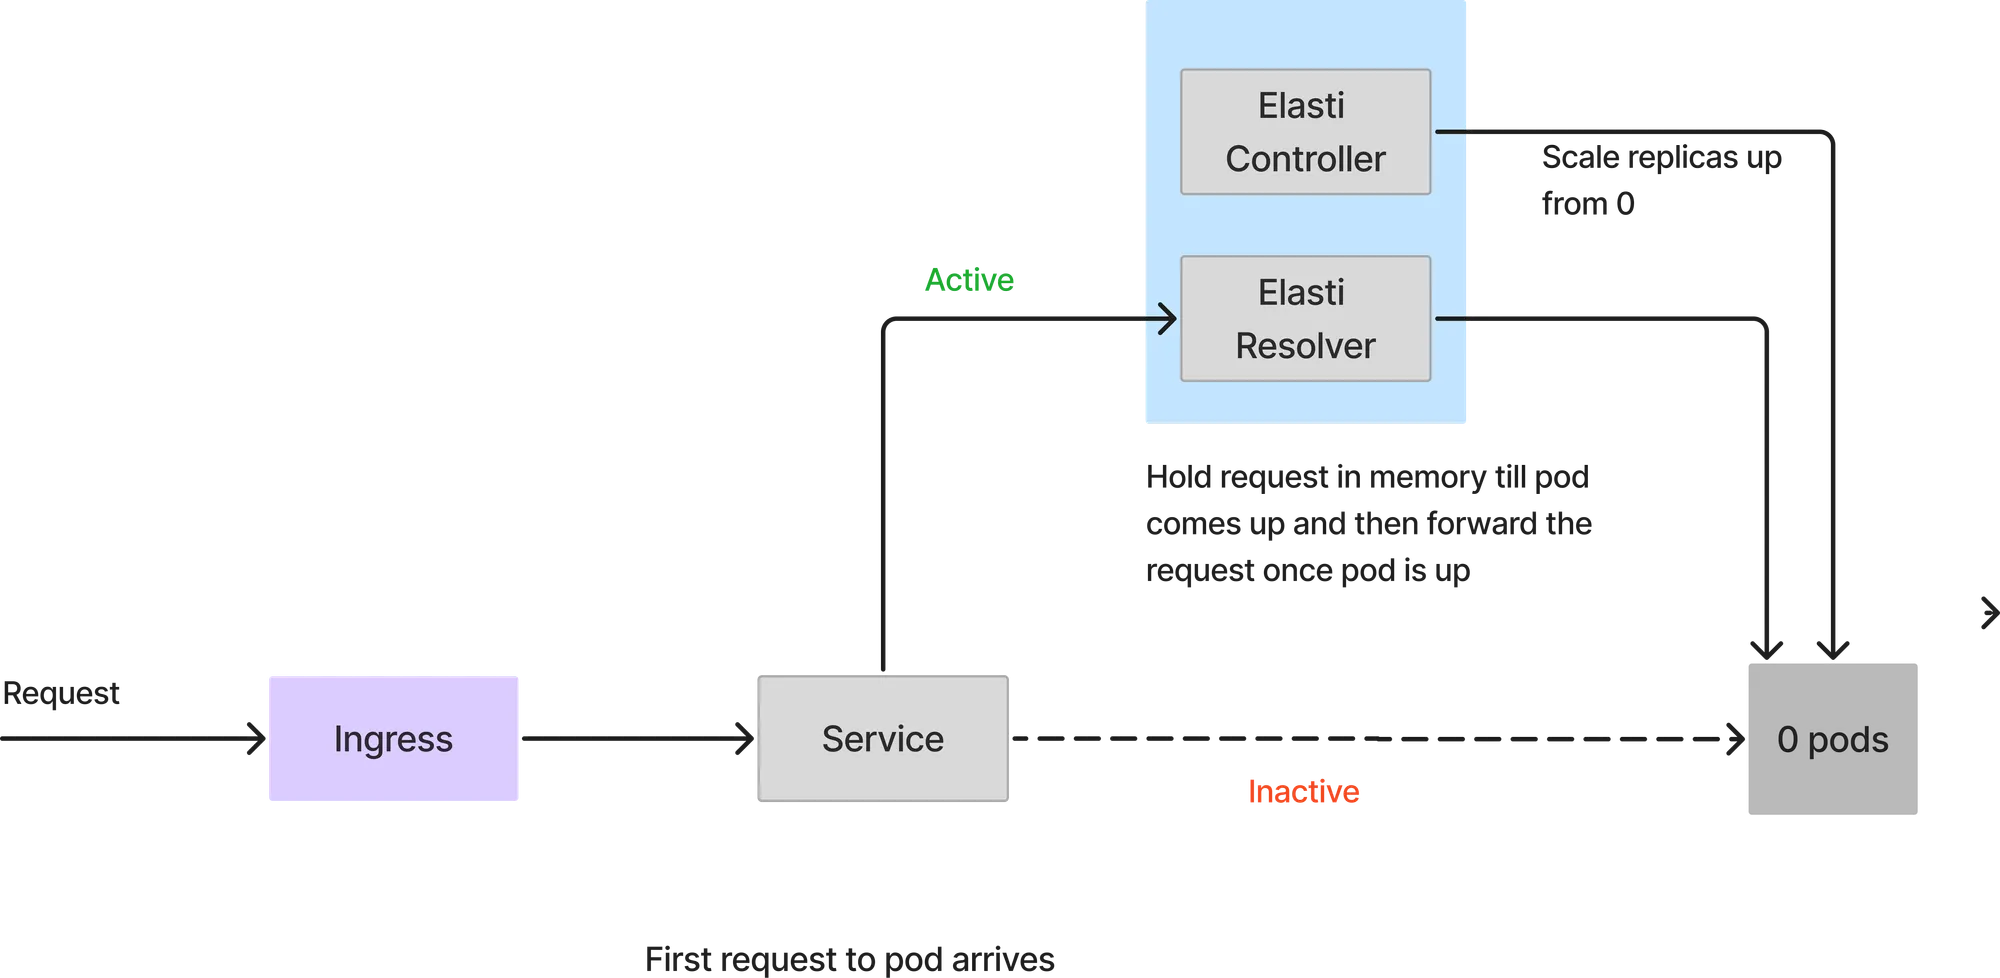
Since the service is scaled down to 0, all requests will hit the Elasti resolver. When the first request arrives, Elasti will scale up the service to the configured minTargetReplicas. It then resumes Keda to continue autoscaling in case there is a sudden burst of requests. It also changes the service to point to the actual service pods once the pod is up. The requests which came to ElastiResolver are retried till 6 mins and the response is sent back to the client. If the pod takes more than 6 mins to come up, the request is dropped.
minikube start
or
kind create cluster --name elasti-demo
or
Create a local cluster with Docker Desktop
helm repo add prometheus-community https://prometheus-community.github.io/helm-charts
helm repo update
helm install kube-prometheus-stack prometheus-community/kube-prometheus-stack \
  --namespace monitoring \
  --create-namespace \
  --set alertmanager.enabled=false \
  --set grafana.enabled=false \
  --set prometheus.prometheusSpec.serviceMonitorSelectorNilUsesHelmValues=false
Install and set up prometheus in the monitoring namespace
Prometheus will be used to read metrics from nginx ingress which will then be used by elasti to query metrics based on which it will decide when to scale a service to and from zero.
helm repo add ingress-nginx https://kubernetes.github.io/ingress-nginx
helm repo update
helm install ingress-nginx ingress-nginx/ingress-nginx \
  --namespace ingress-nginx \
  --set controller.metrics.enabled=true \
  --set controller.metrics.serviceMonitor.enabled=true \
  --create-namespace
Deploys an nginx controller in the ingress-nginx namespace
The controller will be used to route traffic to our demo httpbin service.
4. Setting up Elasti:
helm repo add elasti https://charts.truefoundry.com/elasti
helm repo update
helm install elasti oci://tfy.jfrog.io/tfy-helm/elasti \
  --namespace elasti --create-namespace
Installing Elasti with helm in namespace elasti
Once Elasti is installed, you should see it's two key components running:
For more advanced configurations, check out values.yaml to see all configuration options in the helm value file.
kubectl create namespace elasti-demo
kubectl apply -n elasti-demo -f \
https://raw.githubusercontent.com/truefoundry/elasti/refs/heads/main/playground/config/demo-application.yaml
Deploying a httpbin service in the elasti-demo namespace
This httpbin service will be used to demonstrate how to configure a service to handle traffic via elasti.
Create a yaml file with the following config for an ElastiService.
apiVersion: elasti.truefoundry.com/v1alpha1
kind: ElastiService
metadata:
  name: httpbin-elasti
  namespace: elasti-demo
spec:
  minTargetReplicas: 1
  service: httpbin
  cooldownPeriod: 5
  scaleTargetRef:
    apiVersion: apps/v1
    kind: deployments
    name: httpbin
  triggers:
    - type: prometheus
      metadata:
        query: sum(rate(nginx_ingress_controller_nginx_process_requests_total[1m])) or vector(0)
        serverAddress: http://kube-prometheus-stack-prometheus.monitoring.svc.cluster.local:9090
        threshold: "0.5"
demo-elasti-service.yaml
Once the file is created, apply the ElastiService
kubectl apply -f https://raw.githubusercontent.com/truefoundry/elasti/refs/heads/main/playground/config/demo-elastiService.yaml
A few key fields in the CRD spec are:
minTargetReplicas: Min replicas to bring up when first request arrives.cooldownPeriod: Minimum time (in seconds) to wait after scaling up before considering scale downtriggers: List of conditions that determine when to scale down (currently supports only Prometheus metrics)scaleTargetRef: Reference to the scale target similar to the one used in HorizontalPodAutoscaler.For more details and configuring an ElastiService for your use case, please refer this doc.
With these steps, you now have:
This configuration helps you test real-world routing scenarios and monitor the performance and metrics of your ingress traffic.
To test this setup, you can send requests to the nginx load balancer and monitor the pods of our demo service.
kubectl port-forward svc/nginx-ingress-nginx-controller \
  -n ingress-nginx 8080:80
Port forward to the nginx controller
kubectl get pods -n elasti-demo -w
Start a watch on the httpbin service
Now you can send a request to http://localhost:8080/httpbin and you can see the service being scaled to 1 replica by elasti.
curl -v http://localhost:8080/httpbin
Send a request to the httpbin service
The service will then be scaled down again after no activity for cooldownPeriod seconds specified in the ElastiService (5 seconds in this case).
To uninstall Elasti, you will need to remove all the installed ElastiServices first. Then, simply delete the installation file.
kubectl delete elastiservices --all
helm uninstall elasti -n elasti
kubectl delete namespace elasti
Elasti is the best choice when you:
Elasti was developed out of the necessity to address a specific challenge in Kubernetes: implementing true scale-to-zero without sacrificing request integrity or imposing excessive overhead. This solution supports native autoscaling with HPA and KEDA, ensuring that existing service configurations remain unchanged while achieving efficient resource utilization.
By open-sourcing this tool, we aim to provide a robust solution for environments that require genuine scale-to-zero, zero request loss, and a minimal operational footprint.
We welcome contributions and feedback from the community—explore the development doc for more details.
TrueFoundry AI Gateway delivers ~3–4 ms latency, handles 350+ RPS on 1 vCPU, scales horizontally with ease, and is production-ready, while LiteLLM suffers from high latency, struggles beyond moderate RPS, lacks built-in scaling, and is best for light or prototype workloads.
Kubernetes scale to zero means reducing the number of running pods for a workload all the way down to zero replicas during periods of inactivity. When no traffic or demand is present, the deployment consumes no compute resources and incurs no cloud costs. When a new request arrives, the system automatically scales back up from zero and serves the workload.
The primary tools enabling scale to zero in Kubernetes include KEDA (Kubernetes Event-Driven Autoscaling), which scales based on external event sources like queues and HTTP traffic, and Knative Serving, which provides serverless-style scale-to-zero behavior for containerized workloads. TrueFoundry's deployment infrastructure also builds on these primitives to offer scale-to-zero for ML model serving, reducing GPU and CPU costs during idle periods.
Kubernetes does not support scale to zero natively through its built-in Horizontal Pod Autoscaler (HPA), as HPA has a minimum replica count of one. Achieving true scale-to-zero requires additional tools such as KEDA or Knative, which extend Kubernetes' autoscaling capabilities to include zero-replica deployments triggered by external events or HTTP request-based scaling.


The latest news, articles, and resources sent to your inbox
© 2026 All rights reserved.


.webp)
%20(10).webp)


.webp)
.webp)
.webp)
.webp)


.webp)
.png)


.webp)