June 10, 2026
|
5 min read

13 min read
.webp)
Blazingly fast way to build, track and deploy your models!
As large language models become central to modern AI applications, ensuring their reliability, performance, and safety in production is more critical than ever. LLM observability is the ability to monitor, trace, and debug LLM behavior — tracking prompts, latency, token usage, user sessions, and failure patterns. Without robust observability, teams risk hallucinations, cost overruns, and silent failures that only surface when users complain.
This article explores what LLM observability is, what to look for in a tool, and the top platforms in 2026 for prompt-level tracing, performance insights, guardrail metrics, and cost analytics.
LLM Observability is the practice of monitoring, analyzing, and understanding the behavior and performance of large language models in real-world applications. It goes beyond basic logging or metrics, focusing on tracking inputs, outputs, prompt chains, latency, token usage, model versioning, and failure cases.
LLM Observability is the practice of monitoring, analyzing, and understanding the behavior and performance of Large Language Models in real-world applications. It goes beyond basic logging or metrics, focusing on tracking inputs, outputs, prompt chains, latency, token usage, model versioning, and failure cases.
It enables developers and ML teams to detect hallucinations, bias, toxic responses, prompt injection attacks, or unexpected behavior. It also identifies when model outputs drift from expected norms, critical for maintaining consistency and compliance in regulated industries.
With observability, teams can perform real-time debugging, trace the root cause of failures, monitor user interactions, and continuously improve prompts or fine-tuned models.
LLM observability acts as the "eyes and ears" of your GenAI stack. It enables safe scaling by providing visibility and accountability, bridging the gap between experimentation and dependable production deployment.
For a deep dive into the fundamentals, see: What is LLM Observability?
LLM observability captures detailed telemetry across every stage of the LLM lifecycle. Three main components work together:
Prompt-Level Tracing: Each interaction is logged with rich metadata: raw prompt, user context, model version, timestamp, and system response. Advanced tools trace multi-step workflows or agent chains, linking upstream and downstream operations using correlation IDs. This allows debugging of issues like hallucinations, context loss, or performance bottlenecks by tracing the entire inference journey.
Performance and Token Metrics: Platforms track latency, token usage (input/output), throughput, and failure rates in real time. Token-level tracking is critical for managing cost in APIs like OpenAI, where pricing is tied to token consumption. See: real-time LLM cost attribution.
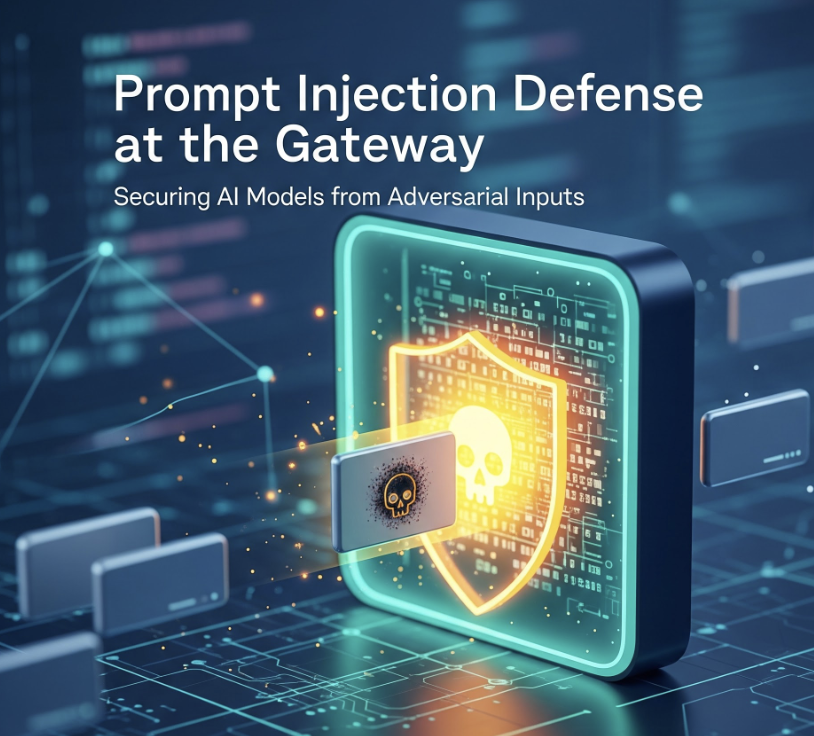
Quality, Guardrails, and Anomaly Detection: Many tools monitor outputs for quality risks like bias, toxicity, or hallucination using statistical or rule-based techniques. They also detect violations of moderation policies or safety thresholds. Some platforms integrate embedding drift analysis to monitor shifts in semantic behavior over time. Related: AI guardrails in enterprise.
These signals are visualized in dashboards and can trigger alerts, integrate with OpenTelemetry, or feed back into CI/CD pipelines.
Selecting the right platform can mean the difference between confidently scaling AI systems and flying blind. Here are the key criteria:
Prompt-level tracing and telemetry: A good tool records prompt content, input metadata, model responses, token usage, latency, and downstream system impact. This visibility is the foundation for diagnosing failures and optimizing cost.
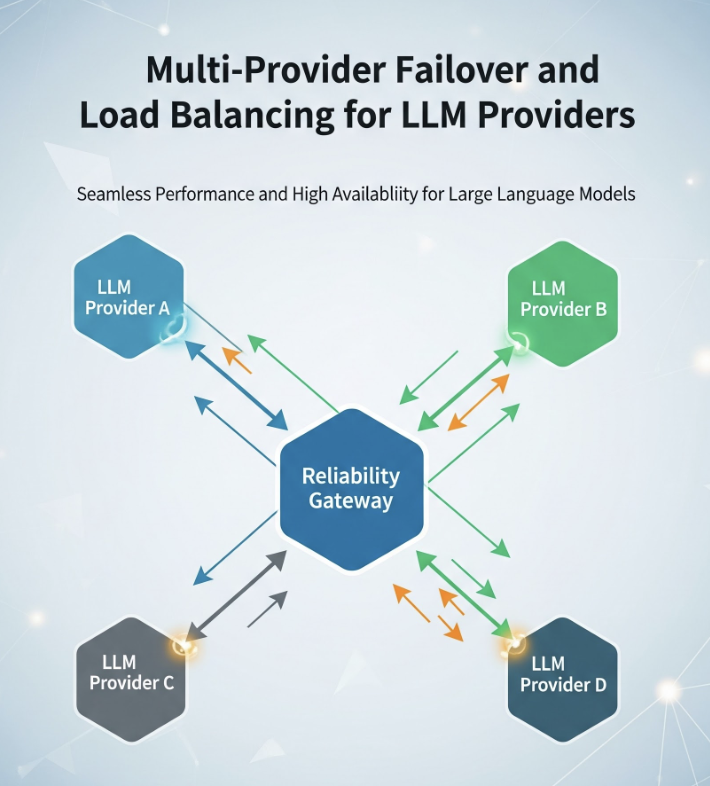
Multi-provider support: Modern applications use different models (OpenAI, Anthropic, Mistral, self-hosted via vLLM). The platform should integrate with all providers and support the OpenAI-compatible API format. See: LLM gateway for centralized multi-provider management.
Real-time monitoring and alerting: Look for real-time dashboards, latency heatmaps, and token consumption metrics with alerting on error spikes, latency anomalies, or prompt failures.
Guardrail violation and policy auditing: Enterprise-grade tools track guardrail violations, instances where inputs or outputs breach moderation or safety policies. Essential for compliance and AI governance.
Cost attribution and budget enforcement: Advanced platforms provide granular LLM cost tracking down to the user, model, or prompt level. Some enforce usage limits through alerts and automated controls. Related: AI cost observability.
RBAC and team-level views: For large organizations, filter data by user, team, or project with scoped access so teams only see relevant traces and logs.
OpenTelemetry and data lake integration: Choose platforms offering APIs, export functionality, and support for data sinks like ClickHouse, BigQuery, or OpenTelemetry. This extends observability into analytics, compliance audits, or model fine-tuning workflows.
Self-hosted / on-prem deployment: For regulated industries, the ability to run observability within your own VPC or air-gapped environment is non-negotiable.
Agentic workflow tracing: As multi-agent systems become common, look for tools that trace multi-step chains, tool calls, and agent-to-agent interactions, not just single LLM calls.
Drift and anomaly detection: Platforms that monitor embedding drift, semantic drift, and distributional anomalies provide early warning before failures escalate.
.webp)
TrueFoundry captures every stage of an LLM interaction — from prompt generation and model inference to post-processing — creating a full trace with correlation IDs and OpenTelemetry spans. This granular tracking enables developers to pinpoint where latency spikes or errors occur, whether in prompt handling, model response, or downstream processes. Traces are visualized for debugging and stored for compliance auditing, giving transparency into every decision point in multi-step workflows and agentic systems.
.webp)
Built-in dashboards provide live insights into model latency, token throughput, error rates, rate-limit hits, and fallback events. Aggregated analytics,. latency heatmaps and usage breakdowns, refresh in real time. TrueFoundry supports alerting on thresholds like latency spikes or unusual model drift, ensuring proactive response and minimizing downtime.
.webp)
Every invocation is enriched with metadata — model, user, team, environment, custom tags — with token usage and cost details. This enables precise tracking of spend and usage trends across departments or features. Teams can slice dashboards and export reports for billing transparency, giving engineering, finance, and product teams full visibility into who uses what, at what cost. Deep dive: LLM cost attribution guide.
Runs in secure VPC, on-prem, hybrid, or air-gapped environments. SOC 2 Type 2 and HIPAA compliant. Observability integrates directly with TrueFoundry's AI Gateway — so LLM traffic governance and observability share a single control plane, eliminating the need for separate tooling.
Who should choose TrueFoundry: Organizations that need production-grade observability integrated with LLM governance, cost management, and compliance — not a standalone monitoring add-on. Especially strong for teams running multi-provider or multi-agent workloads.
.webp)
LangFuse is an open-source observability platform built specifically for LLM applications. It provides full prompt-response tracing including input metadata, model outputs, latency, and token usage. LangFuse integrates seamlessly with LangChain, OpenAI-compatible APIs, and other LLM stacks, making it ideal for developers building multi-step or agentic workflows. It supports tracing across chains, enabling visualization of nested calls, tool usage, and reasoning paths in real time.
The platform logs detailed telemetry for each user session, filterable by project, user, or model. LangFuse supports prompt versioning and change tracking over time — making it easier to debug regressions or iterate on prompt engineering. Teams can self-host or use the managed cloud version. Its intuitive UI and fine-grained log control make LangFuse a developer-friendly choice for teams that prioritize transparency and debugging.
Considerations: Cost attribution is basic compared to enterprise platforms. Advanced governance features require the paid tier.
Teams evaluating observability depth and gateway-level capabilities often explore comparisons like LangFuse vs Portkey to understand differences in tracing, routing, and cost attribution before choosing a production-ready solution.
.webp)
Helicone is a lightweight observability layer purpose-built for OpenAI-compatible APIs. It acts as a proxy that logs every LLM API request, capturing prompt content, token usage, latency, response time, and error codes. Minimal configuration required — developers integrate by simply changing their API endpoint.
Its core strength is cost visibility and team-level insights. It tracks usage across environments, supports virtual API keys, and lets teams break down costs per user, model, or route. Real-time visibility into prompt-level logs, request volume, and performance trends helps teams catch issues and manage budgets.
Helicone supports alerts on usage spikes or failures and integrates with external logging tools. Open-source and self-hostable — a flexible option for startups and dev teams that want fast observability without heavy infrastructure.
Considerations: Lacks advanced enterprise governance, RBAC depth, and AI guardrails capabilities compared to full-stack platforms.
Also explore: Top 5 Helicone Alternatives
.webp)
PromptLayer is a purpose-built observability and prompt management platform for LLM applications. It tracks, versions, and evaluates every prompt-response pair in real time — making it easier to debug model outputs and optimize prompt quality. Native support for OpenAI and LangChain, capturing metadata like timestamps, latency, token usage, and success/failure status with minimal integration effort.
Prompt version control is its core differentiator. Developers can annotate changes, compare outputs, and monitor how prompt tweaks impact model performance over time , especially useful for teams running A/B tests or iterating rapidly on user-facing AI features. PromptLayer also supports tagging, grouping, and searching logs across users, models, and applications.
Considerations: Limited cost attribution, no self-hosted option, and lighter enterprise governance compared to full-stack platforms. Better suited for prompt engineering workflows than production operations monitoring. Related: prompt management tools comparison.
.webp)
WhyLabs LangKit is a specialized observability toolkit focused on detecting risks in LLM outputs — hallucinations, bias, and toxic language. Designed for teams deploying generative AI at scale, LangKit integrates with model inference pipelines and continuously scans outputs for anomalies using statistical and rule-based techniques.
Unlike tracing tools, LangKit emphasizes output quality and behavioral analysis. It monitors shifts in embeddings, semantic drift, and distributional anomalies that may indicate emerging reliability issues. It surfaces explainability signals — helping teams understand why certain generations are flagged and refine prompts, model choices, or guardrails accordingly.
Particularly valuable in regulated environments or customer-facing applications where poor LLM output has real consequences. Integrates with observability backends including the WhyLabs Platform and OpenTelemetry.
Considerations: Weak on prompt-level tracing, cost attribution, and multi-provider management. Best used as a safety and quality monitoring layer alongside a primary observability platform.
.webp)
Arize AI offers advanced observability and evaluation features tailored for production-grade LLM deployments. Originally built for ML model monitoring, Arize has extended to support large language models — focusing on post-deployment analysis, data drift detection, and RAG health.
Embedding drift monitoring is Arize's key strength — tracking changes in vector representations over time to flag semantic shifts in user queries or model behavior. It supports LLM-specific evaluations: hallucination detection, relevance scoring, and prompt-output alignment. RAG pipelines benefit from visibility into retriever latency, content match rates, and knowledge gaps.
Integrates with OpenAI, Cohere, Hugging Face, and custom LLMs. Supports slicing by prompt type, user segments, and feedback loops for fine-grained analysis.
Considerations: Self-hosted deployment is limited. Cost attribution is less granular than purpose-built LLM gateway platforms. Better for quality and drift analysis than operational governance.
TrueFoundry integrates directly with Arize - see: Arize integration with TrueFoundry.
.webp)
Comet ML extends its ML experimentation and tracking suite to include comprehensive LLM observability. Designed for research and production teams, it enables detailed tracking of prompts, responses, token counts, latency, and user-level interactions. Supports both prebuilt and custom metrics, adaptable for prompt tuning, model evaluation, and A/B testing.
Tight integration across the model lifecycle is its differentiator, unifying monitoring from fine-tuning through deployment. Teams can compare prompt variants, visualize performance over time, and annotate runs for collaborative debugging.
Integrates with OpenAI, Hugging Face, LangChain, and custom endpoints. For teams already using Comet for model development, this extension adds governance to the LLM usage layer without introducing a separate platform.
Considerations: Self-hosted deployment is limited compared to open-source alternatives. Cost attribution and enterprise governance are less developed than dedicated LLM observability platforms.
As LLMs become foundational in modern applications, observability is no longer optional — it's how you maintain reliability, control costs, and meet compliance requirements at scale. The right platform depends on your stack, governance requirements, and deployment model.
TrueFoundry leads for enterprises that need end-to-end observability integrated with LLM governance and cost management. LangFuse and Helicone are strong developer-friendly options for lighter setups. Arize and WhyLabs fill specialized niches in quality monitoring and drift detection.
Investing in observability today ensures safer, smarter LLM systems tomorrow , and prevents the silent failures that only surface when users are already affected.
TrueFoundry AI Gateway delivers ~3–4 ms latency, handles 350+ RPS on 1 vCPU, scales horizontally with ease, and is production-ready, while LiteLLM suffers from high latency, struggles beyond moderate RPS, lacks built-in scaling, and is best for light or prototype workloads.
The best LLM observability platform ensures reliable scaling of your AI applications. TrueFoundry stands out by offering seamless integration and robust performance monitoring for diverse models. It provides granular cost monitoring, making it an ideal choice for optimizing LLM apps while preventing expensive overruns and ensuring high response quality.
The top LLM observability tools for 2026 include TrueFoundry, LangSmith, Arize, WhyLabs, and PromptLayer. These platforms offer key features like prompt-level tracing and production traces. TrueFoundry excels with flexible deployment options, helping teams manage production workloads efficiently while meeting specific governance and data privacy needs.
When evaluating LLM observability tools, prioritize data privacy, low latency, and secure access control. The right observability platform must handle sensitive data safely while offering real-time performance tracking. TrueFoundry meets these criteria with seamless integration and comprehensive telemetry data, ensuring your production data remains secure.
Most modern LLM observability tools add very little latency, usually a few milliseconds per request. Platforms like TrueFoundry optimize telemetry collection using asynchronous logging and lightweight tracing, ensuring observability does not significantly impact production performance or user experience.
For enterprises that require data privacy and infrastructure control, self-hosted observability platforms are often preferred. TrueFoundry and Langfuse are among the strongest self-hosted options because they support secure deployments, flexible integrations, and complete visibility into production LLM workloads and telemetry data.
As a leading LLM observability platform, TrueFoundry captures detailed telemetry data across all production environments. It provides low-latency insights and token cost tracking, helping teams optimize every LLM call. With end-to-end tracing and user feedback loops, it empowers developers to debug complex AI workloads effectively.
While LLM observability tools vary, open source options often allow self-hosting for flexible deployment options. Commercial solutions typically provide managed infrastructure for reliable AI operations. TrueFoundry bridges these needs, offering an enterprise-grade observability solution that protects sensitive information while simplifying data collection and prompt versioning.


The latest news, articles, and resources sent to your inbox
© 2026 All rights reserved.


.webp)