


.png)
December 30, 2025
|
5 min read

As teams move from AI experiments to production-grade applications, one theme shows up everywhere: observability is non-negotiable. It’s no longer enough to know whether a request succeeded or failed. You need to understand why a model behaved a certain way, which prompts or tools were involved, and how that impacts cost, latency, and user experience.
That’s exactly what the integration between TrueFoundry AI Gateway and Coralogix is built for. TrueFoundry AI Gateway gives teams a single control plane for LLMs and agents across providers and environments, with routing, rate limiting, guardrails, retries, and cost controls on the request path. Coralogix is a full-stack observability platform that unifies logs, metrics, traces, and security data, with real-time analytics that makes it easy to investigate issues and monitor performance at scale.
Together, they give you end-to-end AI observability: from a user request entering the gateway, to the model and tool calls that happen downstream, to the traces and metrics flowing into dashboards and alerts.
Modern AI systems aren’t “one model and one endpoint” anymore. Real deployments span multiple model providers, local and hosted models, retrieval systems, tool calls, and agent frameworks. They also run across dev, staging, and production—often across regions—and the same user experience may traverse multiple services and dependencies.
This complexity makes traditional monitoring fall apart quickly. If you only have scattered logs, you end up guessing: was the slowdown caused by the model provider, retrieval, tool execution, or your own service? If a release caused token usage to spike, which route or feature introduced the change? When production incidents happen, you need the ability to go from a symptom to the exact request path in minutes.
The clean way to do that is to treat AI traffic like first-class application traffic, with traces that show the full request lifecycle and metadata that helps you filter by model, route, environment, latency, and outcomes.
TrueFoundry AI Gateway sits in front of your LLM and agent traffic as a single governed layer. It centralizes model access across vendors and deployments, applies routing rules, rate limits, and guardrails, and provides request-level controls that help teams operate AI reliably in production. The key advantage is consistency: every request follows the same controlled path, and the gateway becomes the natural place to instrument and export telemetry for observability.
Coralogix is built to ingest high-volume telemetry and make it explorable in real time. When traces are available in the same system as your logs and metrics, investigations become faster and more grounded. Instead of trying to reconstruct a story from distributed logs, you can follow the trace, identify the bottleneck span, and correlate that with infrastructure metrics or dependency behavior.
The integration is based on OpenTelemetry, which keeps things standards-based and easy to maintain. TrueFoundry AI Gateway instruments LLM and agent requests using OpenTelemetry and exports traces to Coralogix over gRPC, with rich metadata attached to each trace (such as model, route, application/subsystem identifiers, latency, and status). Coralogix then ingests and analyzes this data so your teams can build dashboards, set alerts, and investigate specific requests end-to-end.
Coralogix supports receiving OpenTelemetry-compatible traces via its ingress endpoint over gRPC, which makes this a direct exporter-to-platform integration rather than a custom pipeline you need to maintain.
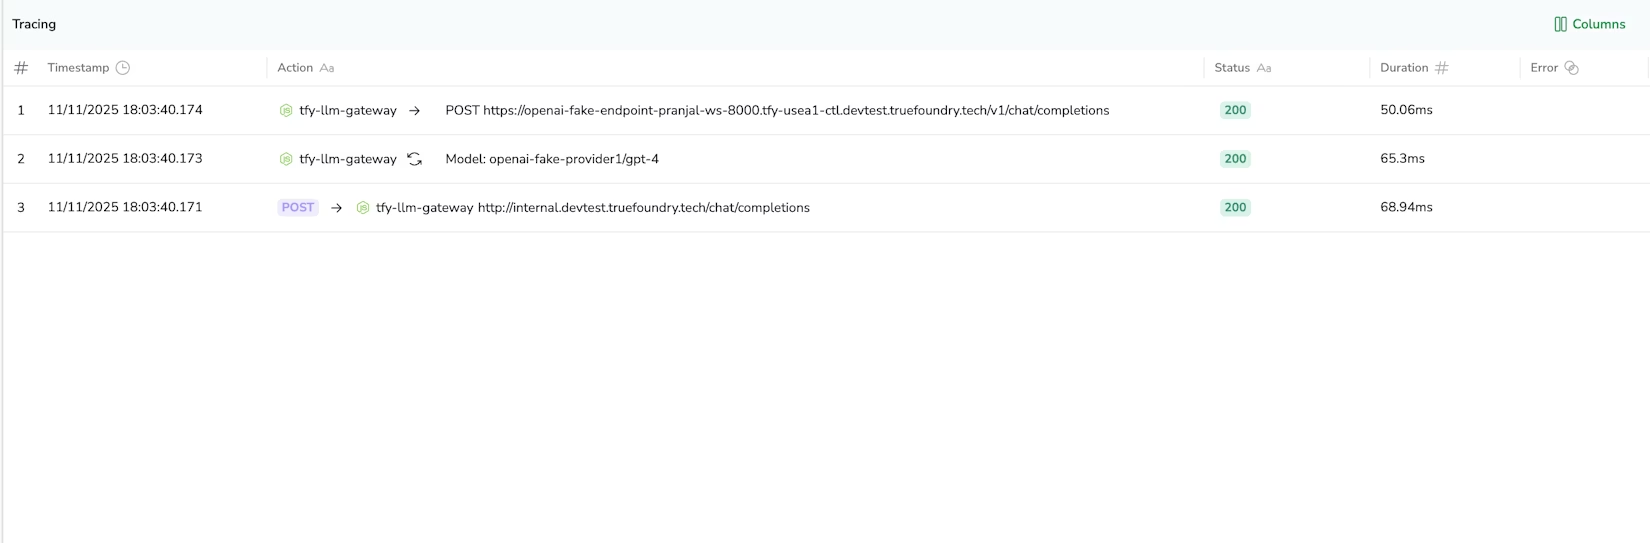
At a high level, a user request hits TrueFoundry AI Gateway, the gateway creates OpenTelemetry spans for the request and the downstream model/tool activity, and the exporter sends those spans to Coralogix’s OpenTelemetry ingestion endpoint over gRPC. The traces arrive in Coralogix already structured, so your teams can filter by application and subsystem, drill into a specific request, and quickly see where latency, errors, or unexpected behavior occurred.
In Coralogix, collect the OpenTelemetry gRPC endpoint for your region, your Coralogix API key, and decide the application and subsystem names you want to use for organizing traces. Picking stable, descriptive names helps later when you build queries and dashboards because you can filter your AI Gateway traces cleanly by those labels.
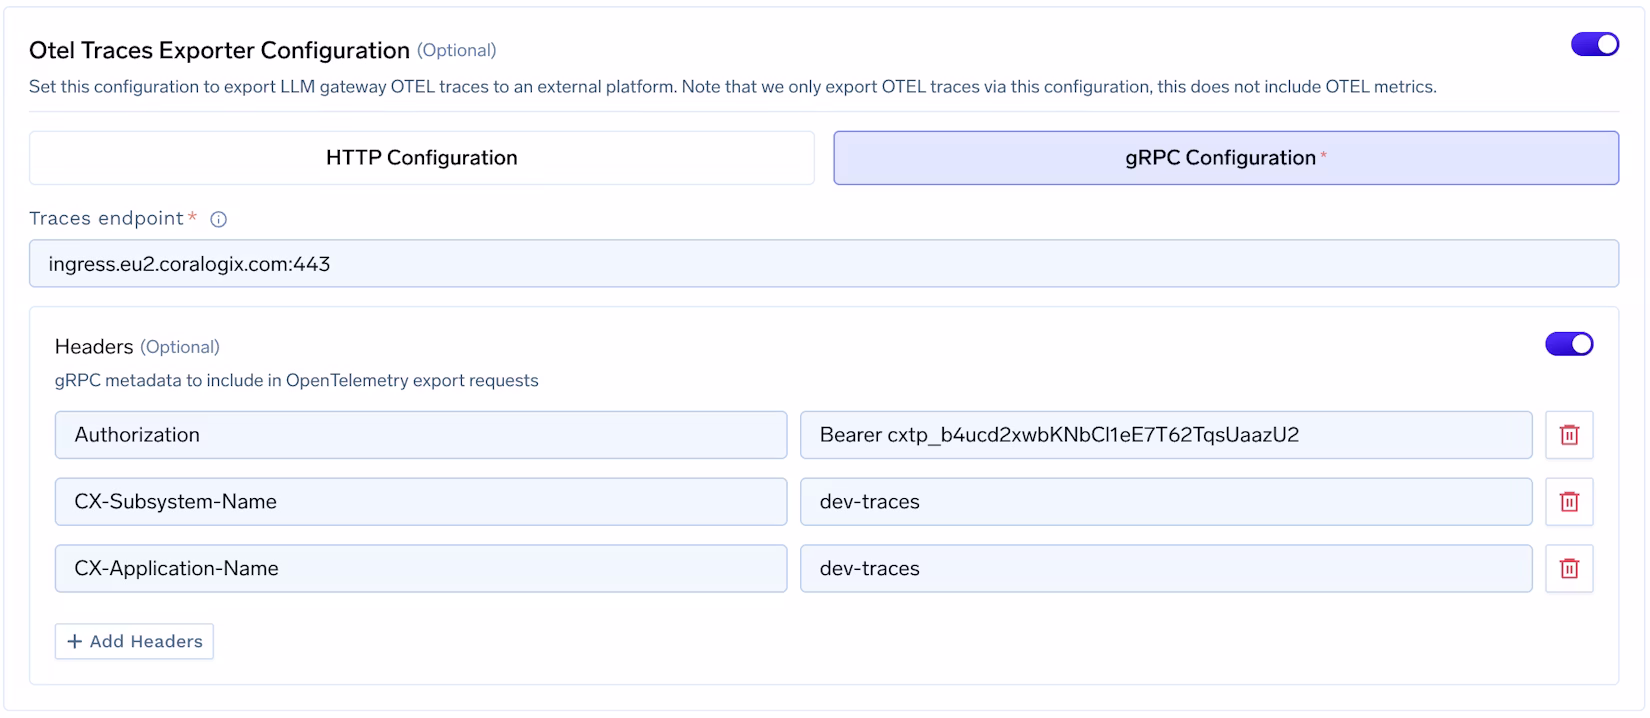
In the TrueFoundry AI Gateway dashboard, open the OTEL configuration for the gateway and enable the traces exporter. Set the protocol to gRPC and configure the endpoint to point to the Coralogix OpenTelemetry ingestion endpoint for your account region. Once this is saved, the gateway will start exporting traces for LLM and agent requests through the configured exporter path.
Coralogix expects headers that both authenticate the request and help attribute traces to the right application and subsystem. In the AI Gateway OTEL exporter configuration, set headers that include your API key plus the application/subsystem identifiers you chose. A typical configuration looks like this:
Authorization: Bearer <coralogix-api-key>
CX-Application-Name: <application-name>
CX-Subsystem-Name: <subsystem-name>
With configuration in place, send test traffic through the gateway (for example, a few chat completions or an agent run). In TrueFoundry, confirm that traces are being created for requests, then switch to Coralogix and open the tracing experience. Filter by the application/subsystem names you configured and verify that you can see the spans corresponding to AI Gateway activity, including attributes like route, model, latency, and status.
With gateway traces in Coralogix, teams can measure latency across routes and models in a way that’s actually actionable in production. Instead of a single “API latency” number, you can see how different models behave under load, which routes are regressing, and whether failures cluster around a specific provider or dependency. Because traces correlate naturally with the rest of your telemetry, you can also connect AI latency to underlying infrastructure or downstream service issues.
AI cost problems often show up as a sudden increase in token usage, longer conversations, or higher call frequency tied to a new feature or release. With request-level metadata in traces, teams can identify which routes or tenants are driving usage changes and set alerts when cost behavior shifts unexpectedly. That insight becomes even more useful when paired with AI Gateway controls like routing rules, rate limits, and budgets, because observability can directly drive corrective action.
Agents feel “slow” or “wrong” for many reasons: tool timeouts, retrieval issues, prompt regressions, or model/provider changes. Traces let teams follow the request across the full chain of calls, drill into the slow span, and identify whether the bottleneck is the model, a tool, retrieval, or your own application logic. This is the difference between guessing and knowing.
Once you have structured traces, it becomes straightforward to build dashboards that reflect how AI is actually used in your product: gateway traffic by route and model, error rate and timeout trends by provider, latency percentiles for key user journeys, and alerts that trigger when a single provider or route starts degrading. This makes incident response faster and reduces the operational risk of shipping AI features quickly.
For performance and compliance, it’s important to export traces to the Coralogix endpoint that matches your account’s region. Coralogix provides an OpenTelemetry-compatible ingress endpoint (over gRPC), and the correct regional endpoint depends on where your Coralogix account is hosted. (Coralogix)
AI applications are quickly becoming mission-critical, and the bar for reliability, performance, and cost control keeps rising. The TrueFoundry AI Gateway and Coralogix integration gives teams a practical, standards-based way to get end-to-end visibility into AI traffic. You centralize control of LLM and agent requests in the gateway, and you centralize observability in Coralogix with real-time traces that make monitoring and debugging dramatically easier.
Blazingly fast way to build, track and deploy your models!
TrueFoundry AI Gateway delivers ~3–4 ms latency, handles 350+ RPS on 1 vCPU, scales horizontally with ease, and is production-ready, while LiteLLM suffers from high latency, struggles beyond moderate RPS, lacks built-in scaling, and is best for light or prototype workloads.


The latest news, articles, and resources sent to your inbox
© 2025 All rights reserved.


