December 19, 2025
|
5 min read

In traditional software systems, failures are usually explicit. A function throws an error, a service crashes, or a request times out. Debugging is largely deterministic. AI agents fundamentally change this model.
Agents are non-deterministic by design. They reason over intermediate steps, choose tools dynamically, and adapt their behavior at runtime. This autonomy enables powerful workflows, but it also introduces new failure modes that are harder to detect and debug.
When an agent fails in production, it rarely crashes outright. Instead, it may enter a loop, select the wrong tool, or produce an incorrect decision based on incomplete or stale context. These failures often surface only as degraded output quality, increased latency, or unexpected cost, without any obvious error signal.
For teams running agents in production, this makes traditional monitoring insufficient. Agent observability is required to understand how agents behave at runtime, identify failure modes early, and operate these systems reliably at scale.
If traditional observability is about checking the pulse of a system, AI agent observability is more like reading its mind. In a standard application, we track the flow of data through fixed code paths. But an agent doesn't have a fixed path. It builds its own road as it runs. This means we need a new set of lenses to see what is happening under the hood.
True observability for agents moves beyond simple uptime and focuses on four specific pillars: traces, tool calls, decision steps, and failures.
Without a trace, you might see that an agent spent three dollars and took twenty seconds to answer a question, but you wouldn't know why. A well-structured trace allows you to replay the entire session. You can see exactly where the agent started, where it got sidetracked, and how it eventually reached a conclusion.
Standard monitoring tools were built for a world where code is a series of predictable, "if-this-then-that" statements. In that world, an error is a hard stop, and a success is a finished task. But when you move to autonomous agents, the boundaries between success and failure become blurry. You can have a system that is technically "healthy" according to your dashboard while it is simultaneously failing your users.
Traditional observability typically relies on two main pillars: logs and metrics. Both fall short when applied to the fluid nature of agentic workflows.
Raw application logs are great for catching a crashed server or a database timeout. However, an agent that is thinking doesn't necessarily produce an error log. It produces a stream of reasoning.
Example scenario: An agent is tasked with finding a specific document in a large database, but is given a slightly ambiguous search tool. The agent might enter a recursive loop, searching, failing to find the result, and then searching again with a minor variation.
From a traditional logging perspective, every one of those API calls might return a 200 OK status. Your logs would show thousands of successful hits, even though the agent is actually stuck and burning through your budget. Without the "why" behind the calls, the raw logs are just noise.
Traditional metrics focus on high-level indicators like CPU usage, memory, and request latency. While these are still important, they are fundamentally context-blind.
In a standard API, a spike in latency is almost always a bad sign. In an agentic system, high latency might actually be a sign of success.
If an agent encounters a particularly complex query and decides to take five extra reasoning steps to ensure accuracy, the latency will spike, but the quality of the result will improve.
Conversely, low latency could mean the agent gave up too early or provided a shallow, hallucinated answer. Without a way to correlate performance metrics with the agent's internal logic and decision path, the numbers on your dashboard can actually be misleading. To truly understand an agent, you need to see the "reasoning span" that ties the metrics to the specific goal the agent was trying to achieve.
To effectively manage agents, we need to stop looking at the aggregate and start looking at the sequence. Because an agent is essentially a series of "loops," the metrics that matter are those that describe the health of each loop and how they connect to the final goal.
If you want to move beyond basic uptime, these are the four key signals your observability stack must prioritize.
In an agentic workflow, a single user prompt can trigger five or six internal reasoning steps. A step-level trace captures the thought the model had at each stage. This includes the specific prompt sent to the LLM, the raw output, and crucially the metadata like token usage and probability scores.
By observing the lineage of these steps, you can pinpoint where logic starts to drift.
For example, if an agent is tasked with generating a report but gets stuck in step three by repeatedly trying to re-format a table, the step-level trace makes this logical friction immediately visible. Without this, you only see a long-running request that eventually times out.
Agents are only as fast as the tools they use. When an agent calls a database or a search API, that tool's response time is added to the agent's total execution time. Observability tools must track tool latency as a distinct metric.
If an agent takes 30 seconds to respond, you need to know if the delay was caused by the LLM "thinking" or by a slow third-party API.
Monitoring tool latency allows you to set specific SLAs for your external integrations. If a particular search tool consistently adds 10 seconds of delay, you might decide to swap it for a faster vector database or optimize the tool's underlying query.
In complex systems, a small error in an early step can cascade into a complete failure at the end. This is known as error propagation. For instance, if a Data Retrieval tool returns a malformed JSON object, the agent might try to "reason" through that bad data in the next step, leading to a hallucinated final answer.
Observability for agents means tracking how an error at the span level impacts the rest of the trace. You need to see the exact moment a tool returned an error and how the agent attempted to recover. Did it retry? Did it gracefully degrade? Or did it continue blindly with a corrupted context?
Unlike a standard chatbot, where a request has a relatively fixed cost, an agent's cost is highly variable. One run might cost five cents, while the next run triggered by the same prompt but requiring more reasoning steps could cost two dollars.
Tracking "cost per run" is the only way to understand the unit economics of your AI feature. This metric aggregates the tokens used across every model call and the costs of every tool invocation in a single session.
By correlating this cost with the user's satisfaction or the task's success, you can identify "high-cost, low-value" patterns and optimize your orchestration logic to be more efficient.
Debugging agents at the application layer quickly becomes impractical as workflows grow in complexity. Agent executions often span multiple models, tools, and services, producing fragmented telemetry.
An AI Gateway provides a centralized observability layer by sitting between applications, models, and tools. Because all interactions pass through the gateway, it can capture a complete and consistent view of agent behavior.
This approach turns observability from a best-effort logging exercise into a structured, system-wide capability.
The gateway acts as a unified interception point for all agent interactions. Prompts, model responses, tool calls, and retries are captured and normalized into a consistent format.
This eliminates the need to correlate logs from multiple services or providers. Regardless of which model or tool an agent uses, execution data is collected centrally and can be analyzed as a single workflow.
By injecting correlation identifiers at the gateway layer, all events related to a single agent execution can be grouped into a hierarchical trace.
This allows teams to view an agent run as a structured sequence of steps, rather than disconnected requests. Unified traces make it possible to identify which specific model call, tool invocation, or reasoning step caused a regression in quality, latency, or cost.
One of the hardest problems in agent debugging is understanding the relationship between model intent and tool behavior.
Because the gateway observes both sides of the interaction, it can correlate:
This cross-layer visibility allows teams to determine whether failures originate from poor prompting, model limitations, or tool-side issues, enabling targeted improvements.
TrueFoundry translates the complexity of agentic behavior into a structured, production-ready observability suite. By acting as a central control plane through its AI Gateway, it allows teams to monitor, analyze, and debug agents across diverse frameworks such as CrewAI, Langroid, OpenAI Agents SDK, and Strands Agents.
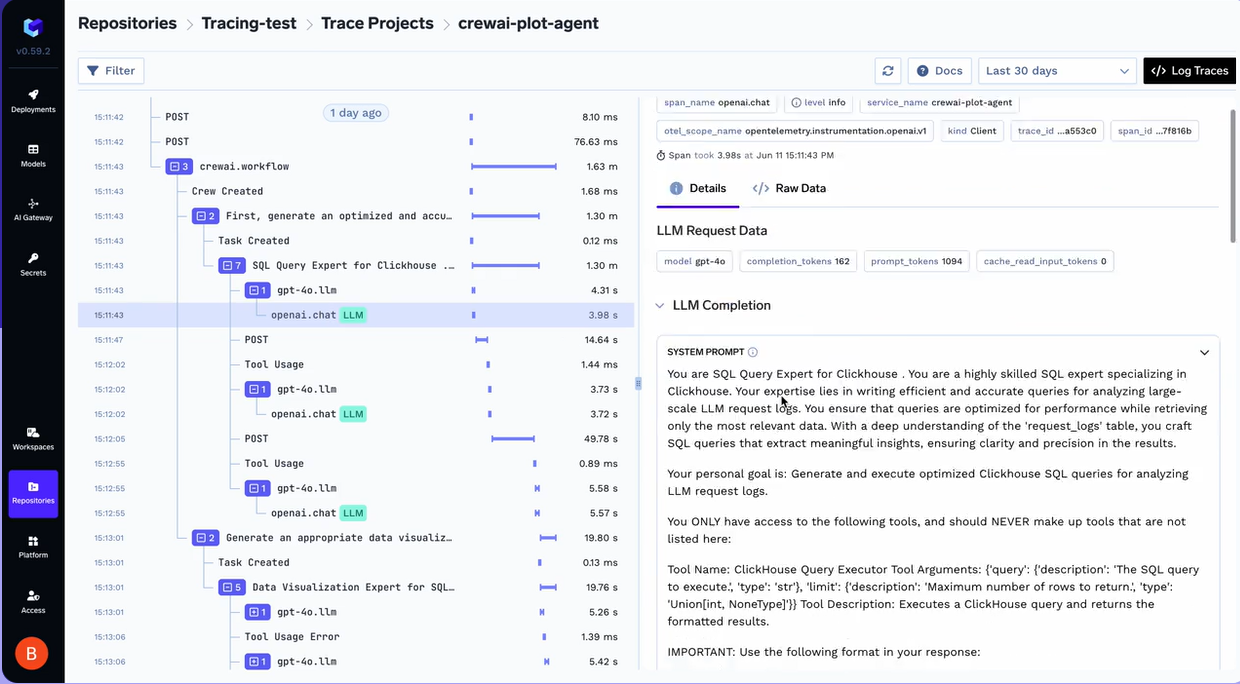
TrueFoundry provides high-fidelity visibility into every step an agent takes. By utilizing the Traceloop SDK, the platform enables detailed trace correlation across complex agent workflows. This goes beyond simple logging; it allows you to see the hierarchical relationship between a user's initial prompt and the subsequent chain of model calls and tool executions.
To get started with tracing, you simply initialize the SDK within your application code.
from traceloop.sdk import Traceloop
Traceloop.init(
    api_endpoint="https://your-truefoundry-endpoint/api/tracing",
    headers={
        "Authorization": f"Bearer {your_pat_token}",
        "TFY-Tracing-Project": "your_project"
    }
)
TrueFoundry addresses the "latency mystery" in agentic systems by tracking granular performance data. The dashboard provides a comprehensive view of:
Governance and cost management are baked directly into the observability stack. TrueFoundry provides detailed breakdowns of input and output tokens, automatically calculating costs per model based on current provider rates.
Teams can analyze Usage Patterns to identify their most active users, see how requests are distributed across different models, and track spend by team for internal chargebacks. With built-in support for Rate Limiting and Budget Controls, TrueFoundry ensures that your agents stay within their operational boundaries, preventing the common "surprise bill" scenario while maintaining the reliability needed for enterprise production.
Operating AI agents in production requires a shift from traditional monitoring to deep observability. Because agents reason, act, and adapt dynamically, their failures are often logical rather than technical.
By centralizing observability at the AI Gateway and providing execution-level visibility into reasoning, tools, and cost, teams can turn opaque agent behavior into something measurable and manageable. With the right observability in place, agents become reliable components of production systems rather than unpredictable black boxes.
Blazingly fast way to build, track and deploy your models!
TrueFoundry AI Gateway delivers ~3–4 ms latency, handles 350+ RPS on 1 vCPU, scales horizontally with ease, and is production-ready, while LiteLLM suffers from high latency, struggles beyond moderate RPS, lacks built-in scaling, and is best for light or prototype workloads.


The latest news, articles, and resources sent to your inbox
© 2025 All rights reserved.